USDA Forecasts Sharpest Decline in U.S. Farm Income in History
Key Takeaways
- Highlighting the volatility inherent in farming and farm income, the U.S. Department of Agriculture’s (USDA) most recent farm income forecast projects U.S. net farm income, a broad measure of farm profitability to plummet by $42 billion in 2023 to $141 billion, resulting in a 23% income drop compared to the year prior. If realized, the $42B decline in U.S. net farm income will be the largest on record in nominal terms and the third largest of all time when adjusted for inflation.
- Given expectations for elevated production expenses alongside weakening crop and livestock prices, farm incomes are likely to be pressured even lower in 2024. The opportunity for Congress to invest in a meaningful and enhanced farm safety net and suite of risk management tools while reauthorizing the farm bill should be a top priority given the headwinds facing the farm economy.
As previously documented here and here, this year’s record-high production expenses combined with weakening prices received by farmers for major crop and livestock products have led to an unsurprising large drop in U.S. net farm income in the Economic Research Service's (ERS) most recent August 2023 Farm Sector Income Forecast. The latest update from ERS reveals that net farm income, a broad measure of farm profitability, is expected to fall by $42 billion, or 23%, from 2022 to $141 billion.
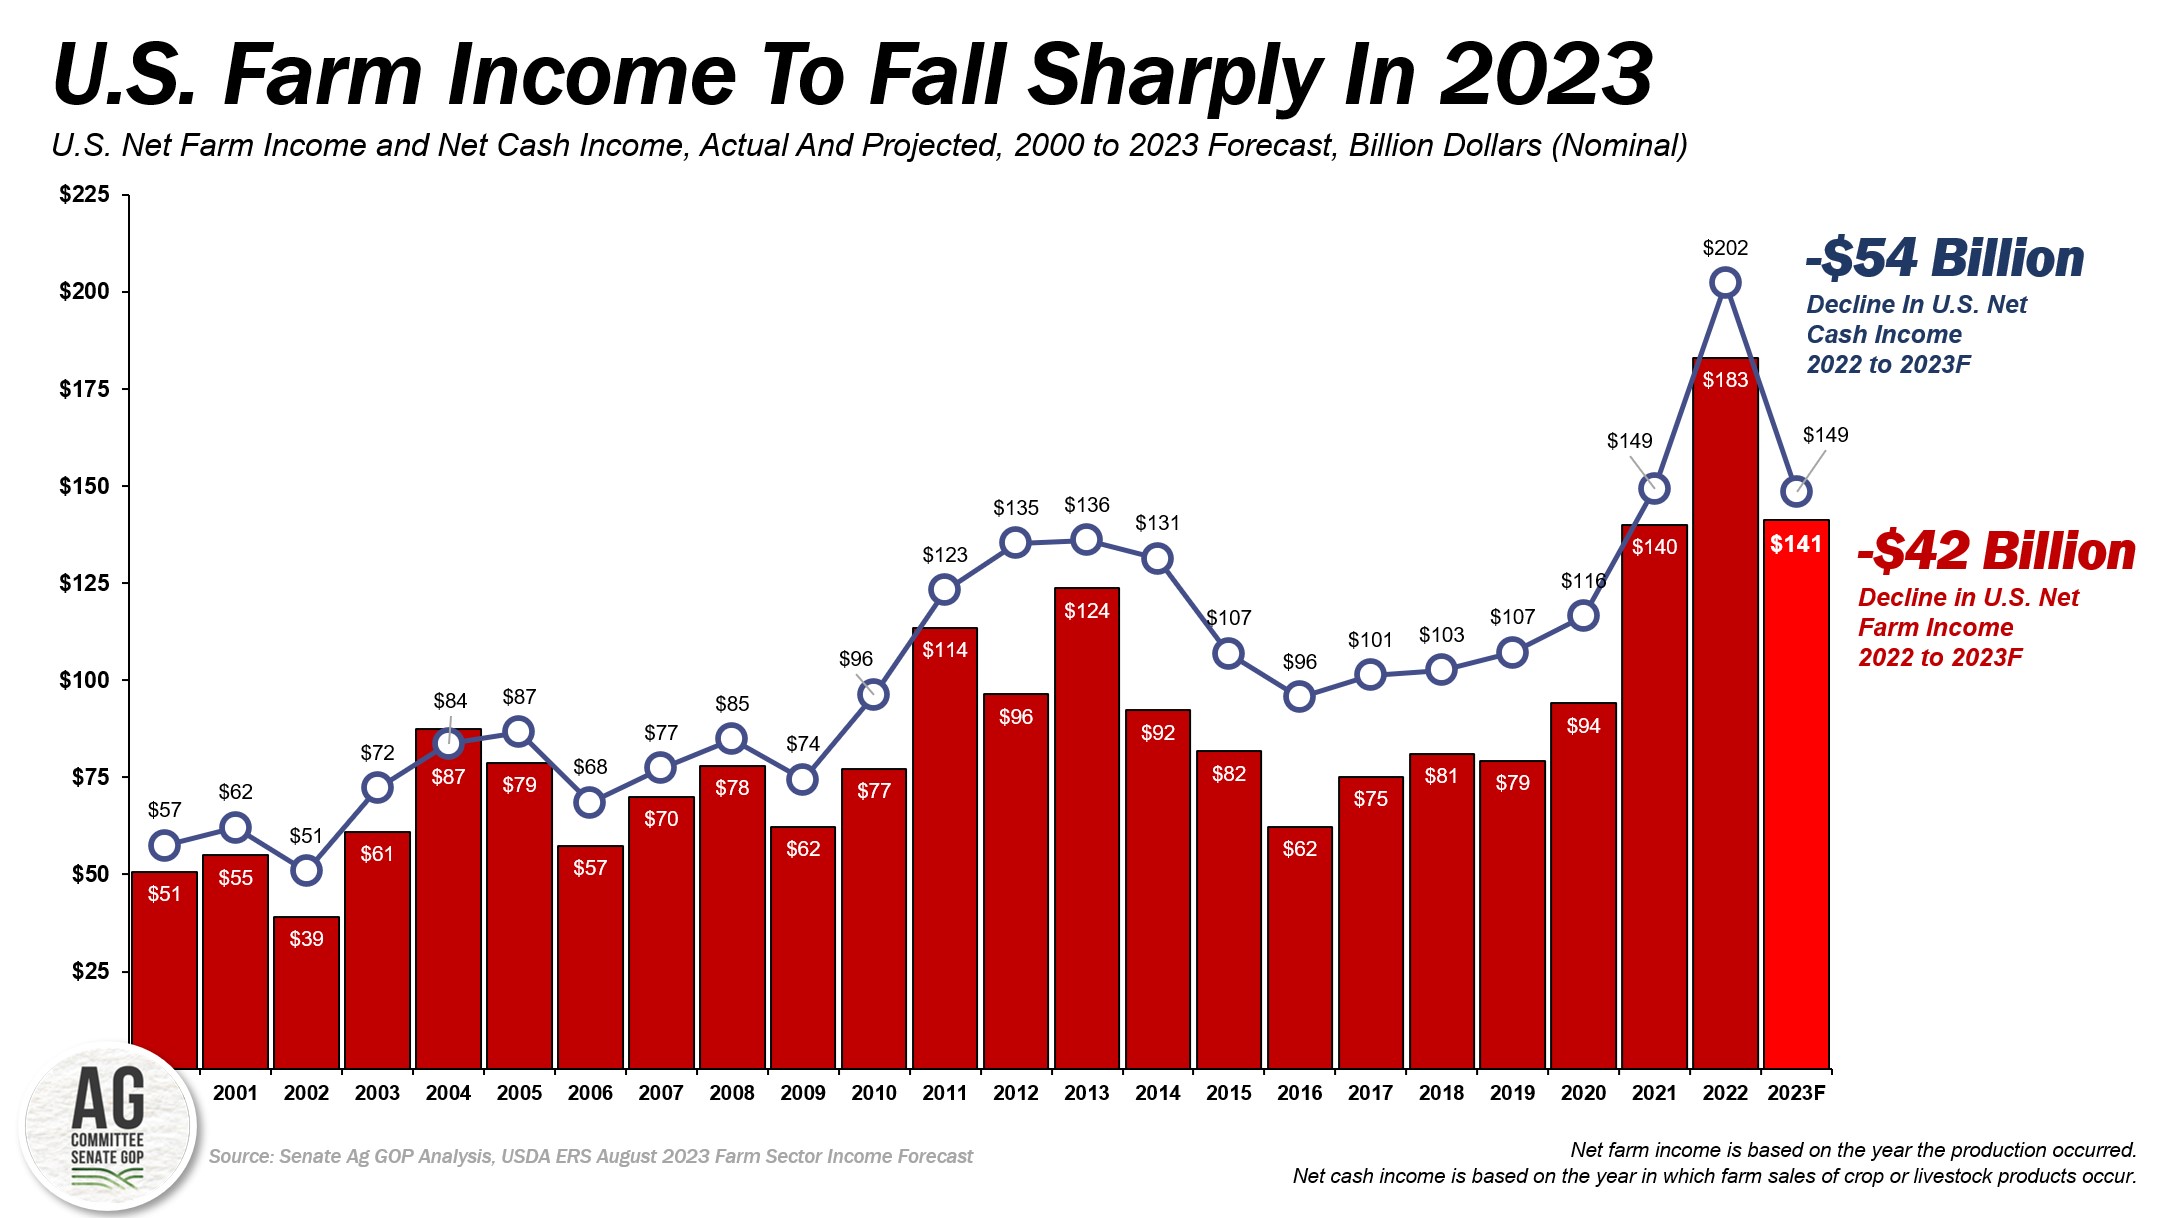
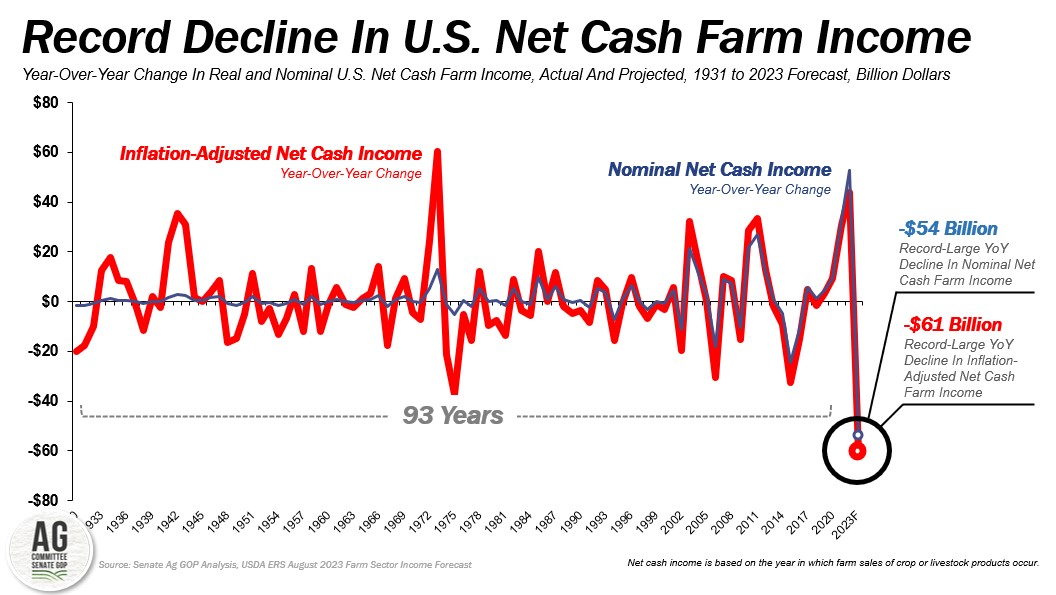
As a result of persistently high input costs and rapidly declining commodity prices, this year’s declines in both net farm income and net cash income are now projected to be the largest declines of all time, at -$42 billion and -$54 billion, respectively.* Even when adjusted for inflation the projected decline in net cash income in 2023 is the worst in history (down nearly $61 billion) and the decline in inflation-adjusted net farm income is the third-worst of all time (down $48 billion).
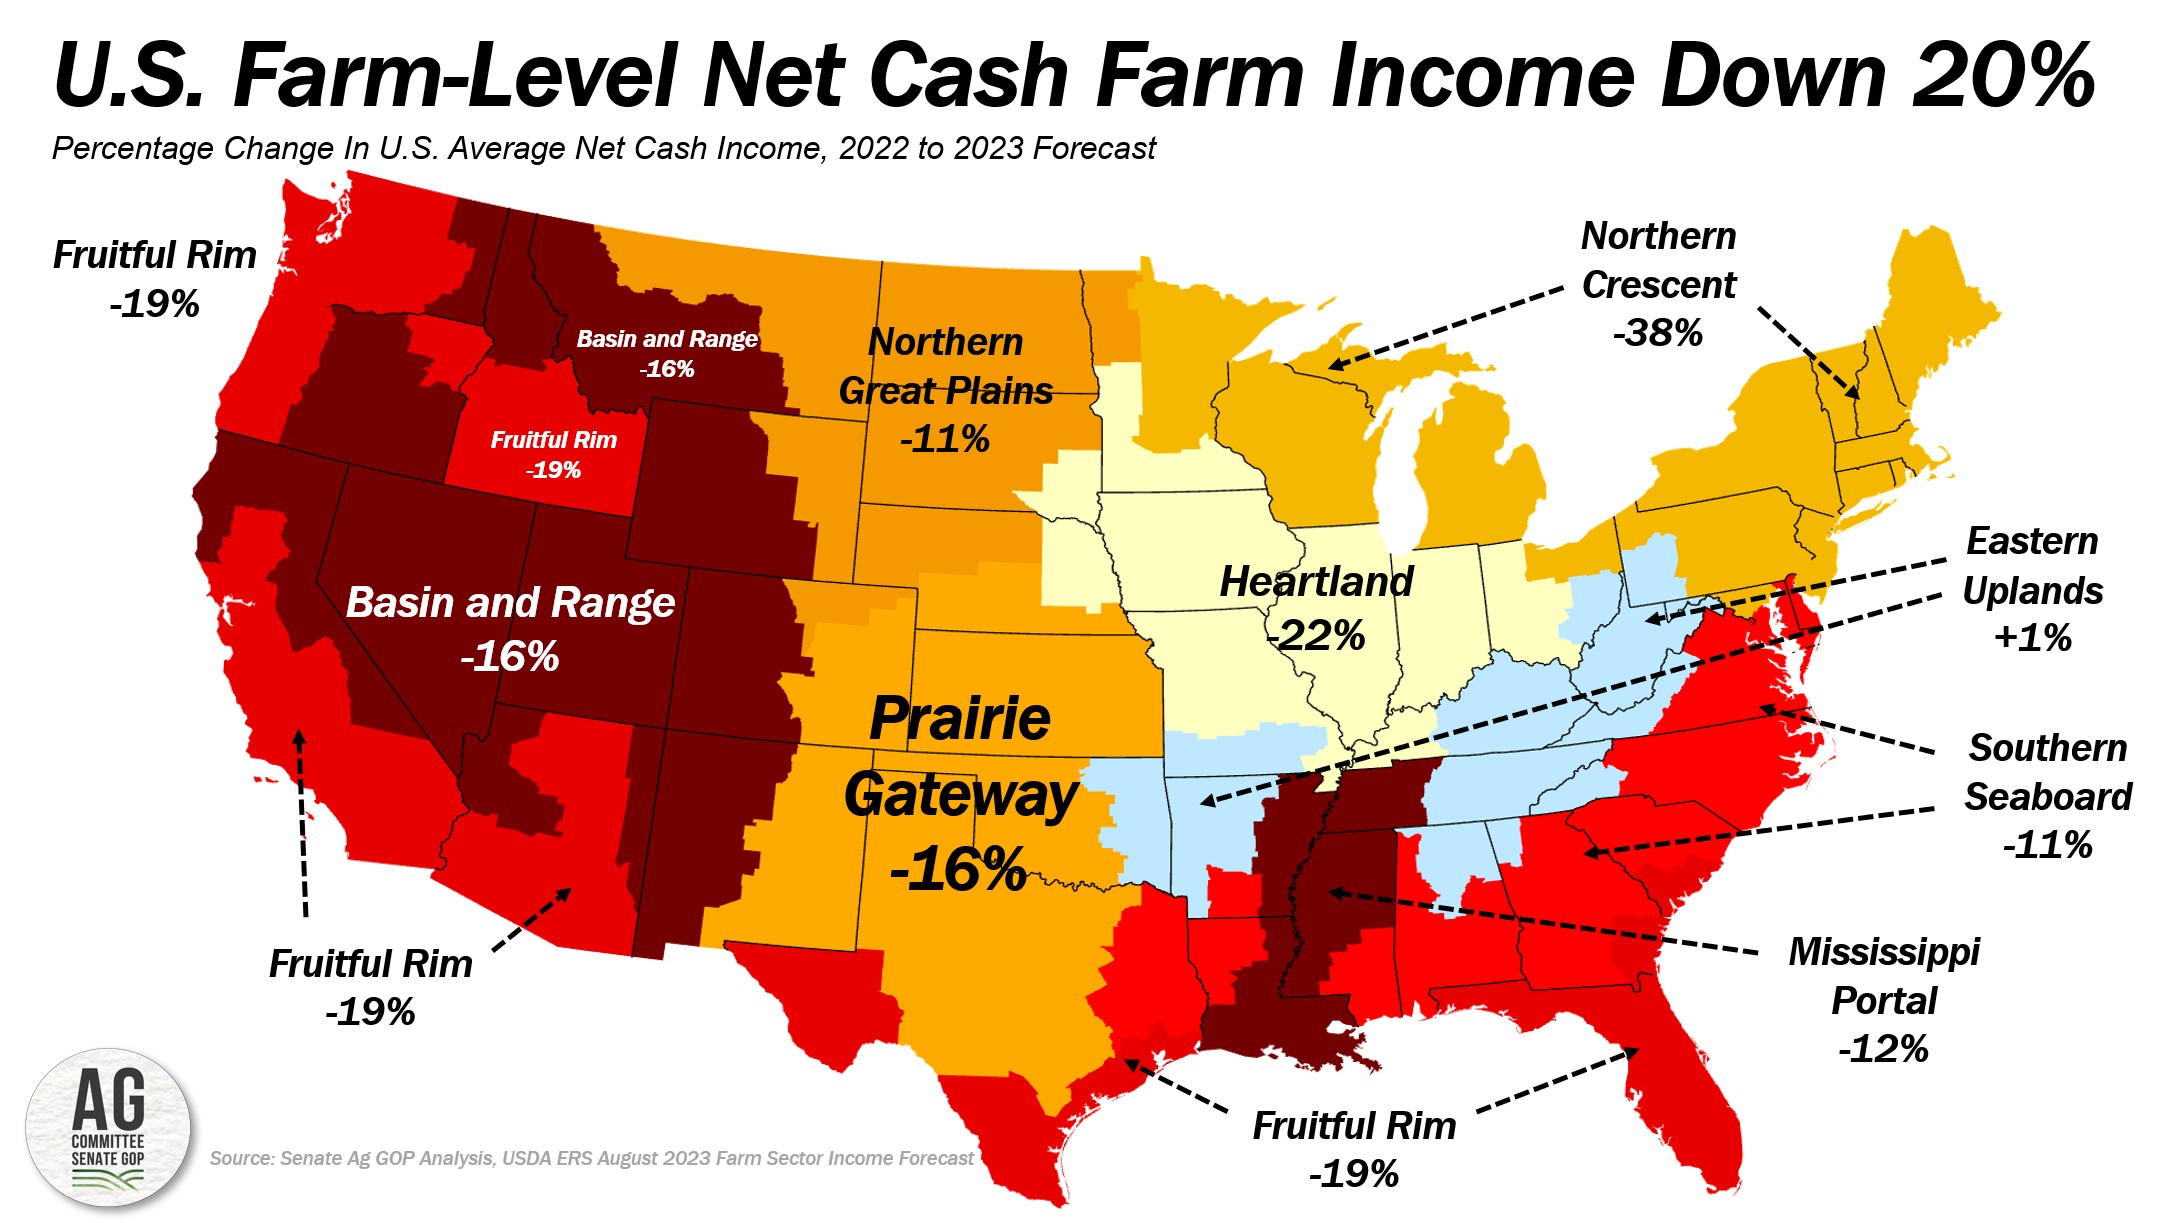
On average, farm-level net cash farm income is projected to decline by 20% from 2022 to $41,700 – also the most significant year-over-year decline since USDA began reporting farm-level net cash farm income in 2010. Across the U.S., 8 out of 9 USDA resource regions are projected to see lower average farm-level net cash farm income. The decline in farm-level net cash income ranges from a low of -11% to a 38% decline in the Northern Crescent – primarily reflecting lower farm income for dairy farm families.
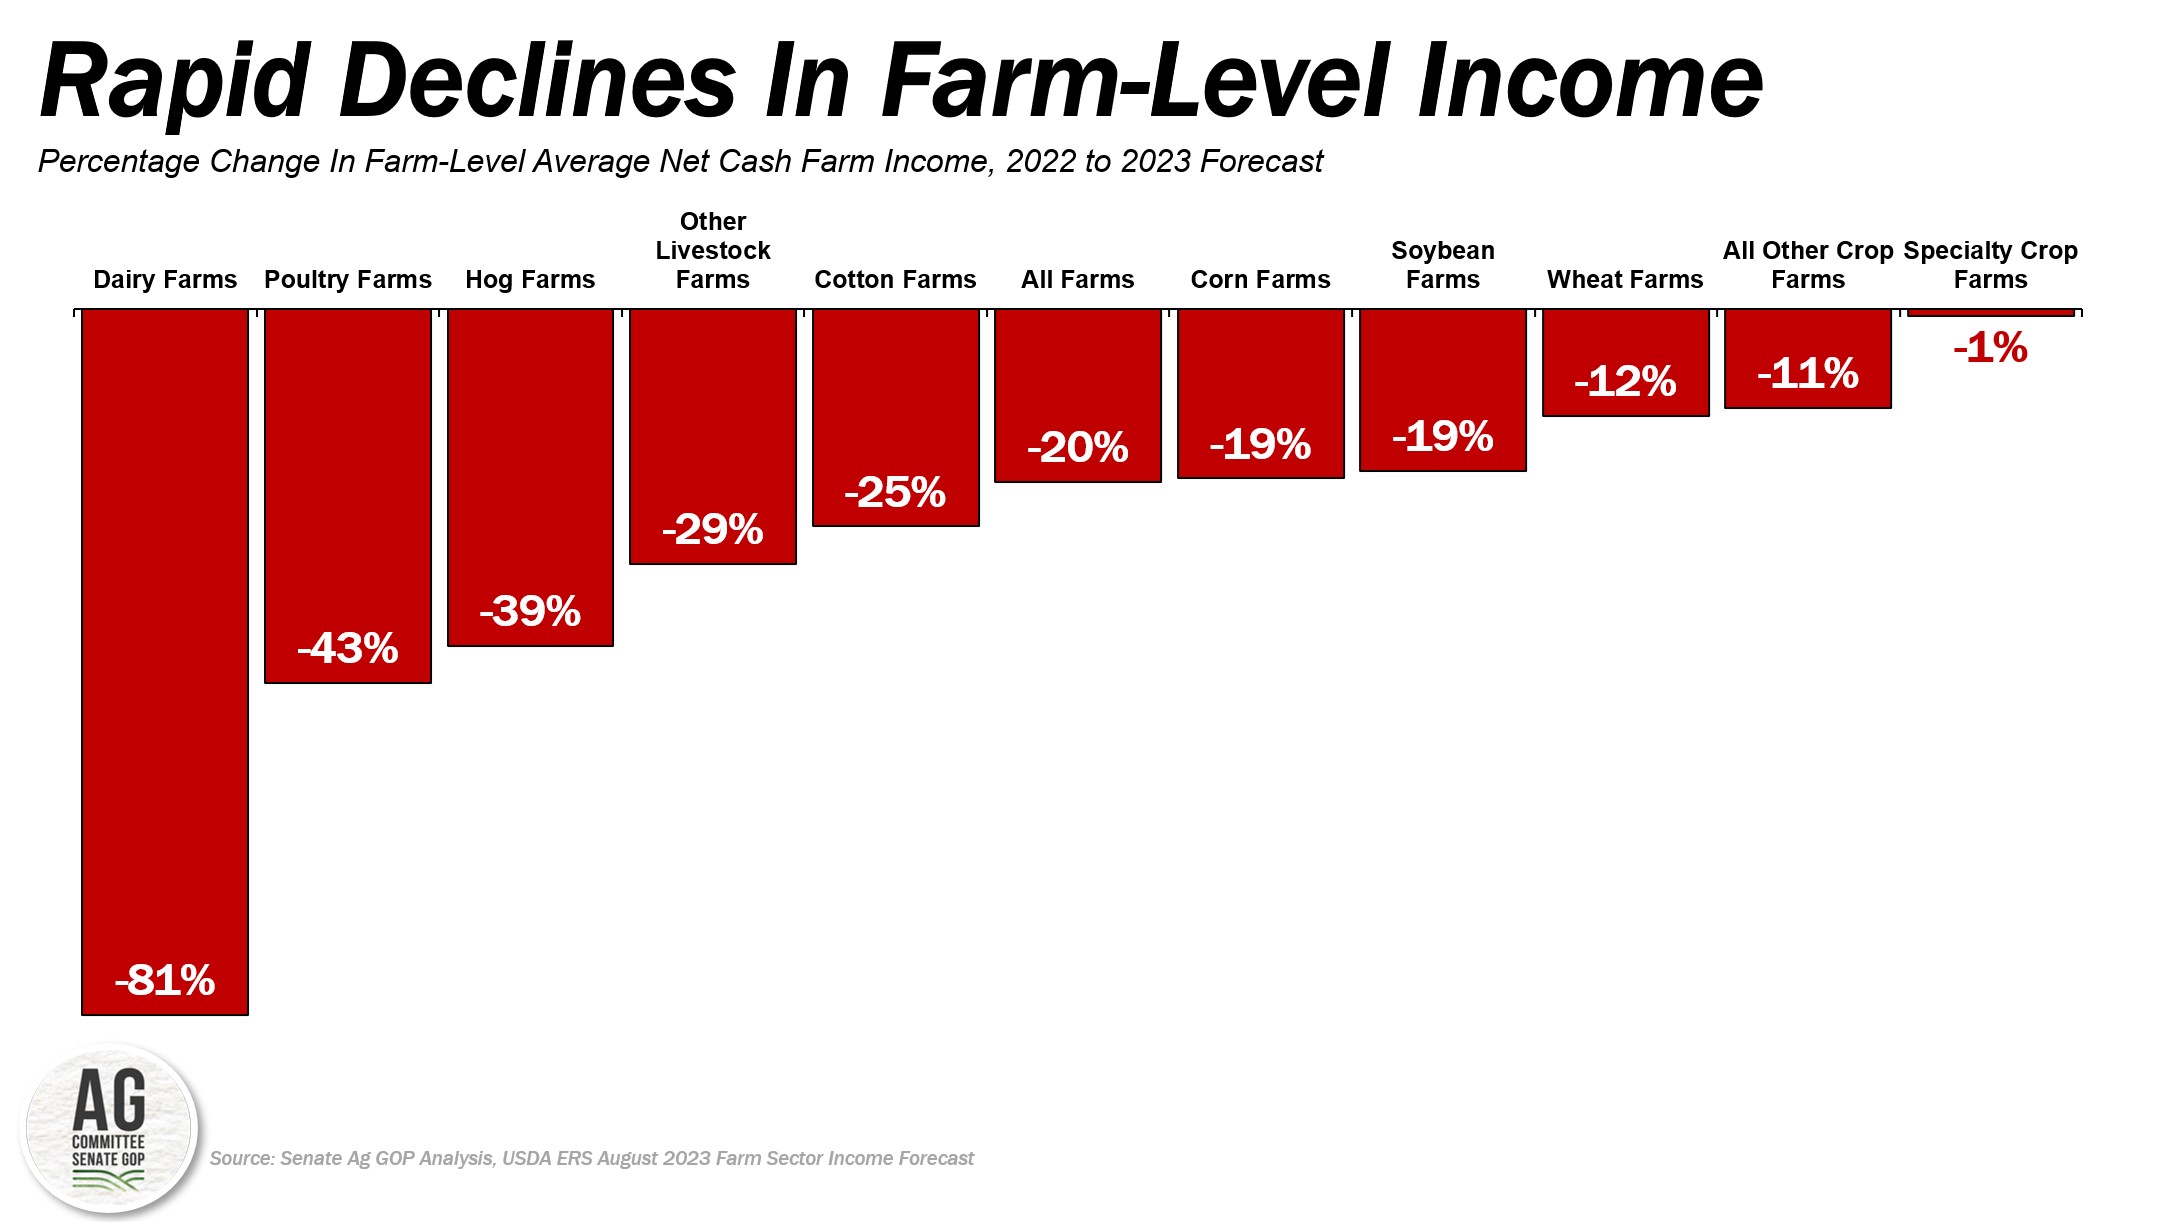
According to ERS, cash receipts for top commodities are projected to drop. ERS projections show:
- Receipts for corn falling by 19%, dropping $8.5B.
- Soybean receipts are also projected to decline by 19%, losing $5.4B.
- Cotton receipts are expected to decrease by 25%, dropping nearly $2B.
- Dairy farm cash receipts are projected to decrease by 81%, declining by $12B.
- Hog receipts are expected to decrease by 39%, losing $3B.
- Poultry receipts are expected to decrease by 43%, dropping more than $12B when you combine broilers, eggs, and turkey.
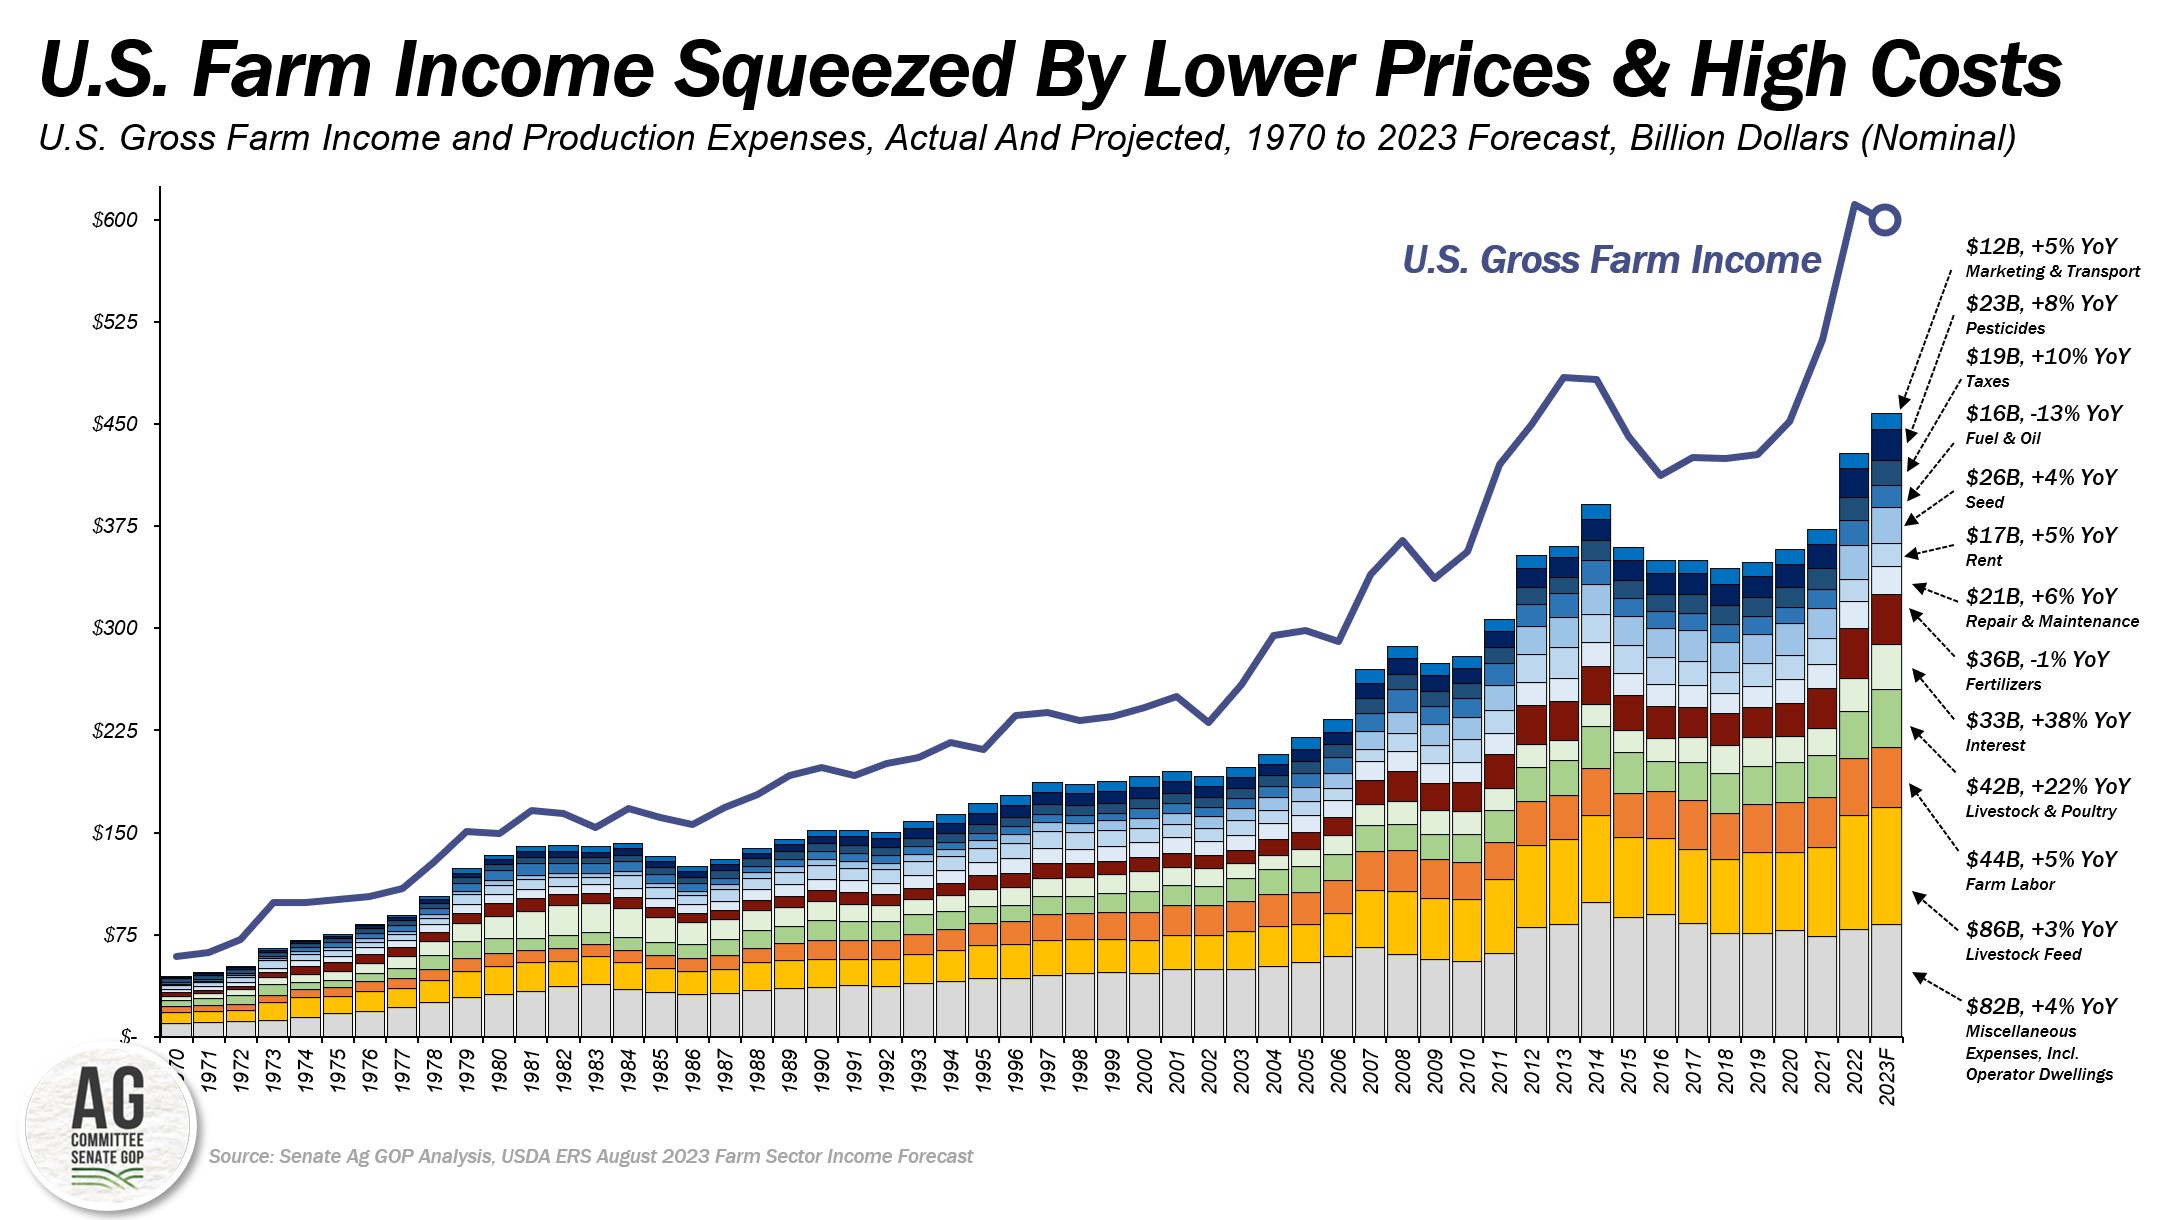
While farm profitability in 2023 does rank among the all-time highs, the outlook moving forward is concerning. Cash receipts from the sales of crops and livestock are projected to fall by a combined $23 billion in 2023 to $513 billion. Importantly, of the projected $23 billion decline in farm cash receipts, more than $20 billion are price-related declines while less than $4 billion are related to declines in production. Cash receipts for crops are projected at $267 billion in 2023, down 4% or $11 billion from last year. Similarly, cash receipts for livestock products are projected at $247 billion, down nearly 5% or $14 billion from 2022. When including other income sources such as federal support, cash farm-related income from activities like custom harvesting, and inventory adjustments, gross farm income is projected at $599 billion, down $12 billion or 2% from 2022.
As commodity prices continue to face downward pressure and uncertainty in demand, farm production expenses remain elevated. Total farm production expenses are now projected at nearly $460 billion in 2023, up $29 billion from the previous year. Since 2020, however, and driven by sharp increases in interest rates, fertilizer, fuel, labor, and chemical expenses, among others, total farm production expenses have increased by more than $100 billion. Farm production expenses are not expected to show much improvement going into the next growing season as USDA’s June cost-of-production forecast for major field crops shows that only marginal input price declines should be expected.
Headwinds persist in the U.S. farm economy. U.S. agricultural exports are slowing and a record-large trade deficit is projected for 2023. Ending inventories of major grains, oilseeds, poultry, and dairy products are projected to increase into 2024. These factors may combine to push commodity prices lower at a time when input costs are expected to remain elevated. It’s reasonable to expect that given these outcomes farm incomes may be pressured even lower in 2024.** This is concerning in the face of record-high farm debt, higher borrowing costs, higher break-even levels, and likely downward pressure on farmland asset values due to higher interest rates.
Alongside the farm economy contracting by the largest amount of all time in 2023, expectations that the farm economy could weaken again in 2024 emphasize the importance of reauthorizing the farm bill and investing in a meaningful enhancement to the risk management and commodity program tools that farmers and ranchers depend upon to weather a volatile farm economy -- beginning in 2024 and into the future.
* Note: Net cash income is based on the year in which farm sales of crop or livestock products occur and net farm income is based on the year the production occurred.
** USDA’s next projection for 2023 will occur in late November or early December and their first projection for 2024 farm income and wealth statistics will be revealed in early 2024.